Highlight Statistics : L5
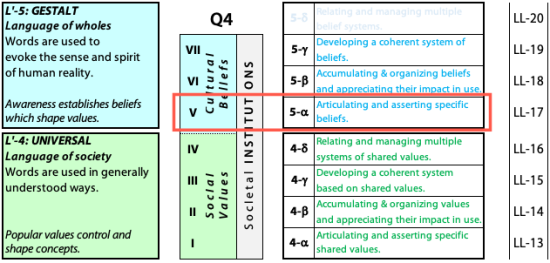
: Articulating and asserting a specific awareness enabling belief.
Mentioning a meaningful statistic can focus awareness and drive belief on an issue previously ignored.

Essence of the Work
To select value-imbued data gathered from the institution or its context in order to jolt awareness and to serve as a basis for belief in the necessity for change.
A key challenge for any society is to ensure that relevant statistics in regard to needs and services are willingly provided by individuals and organisations. Some indicators of functioning may be centrally collected, organised, and made generally available for reference by anyone interested.
Any institution has a vast number of parameters relating to its performance and generates a vast amount of publicly available information relevant to those parameters. There will be thousands of tables and graphs depicting inputs, outputs and contexts. Anything is potentially relevant dependent on the question being asked. To engage with such statistics and find the relevant items may seem a daunting task, but no serious confrontation with vested interests can avoid appealing to data.
Statistics may be used to justify , inform and indicate . However, selecting and publicizing a meaningful to jolt a society and impact on beliefs about the institution is a distinctive use.
To have a useful impact, a selected statistic needs to be intrinsically meaningful while revealing something unexpected or undesired. It is common to find that a single figure is claimed to reflect the functioning of the institution as a whole.
Examples: ![]() International Bodies
International Bodies
A well-chosen statistic not only appears to quantify something fundamental about the institution, it provides an indicator for assessing improvement (as with the infant mortality rate example), and may point to a strategy for improvement (as with the level of female education example).
Statistics do not reflect Reality
For a committed empiricist, most of these statistics emerge from "bad data".
In the analysis of root projections, it became apparent that the psychosocial pressures within the Primary Domains impacted on the form taken by reality and truth. This impact appears to flow through into the Q-Arenas each of which operates under a different pressure.
demand well-being, the pressure emergent from where reality is subjective and truth idiosyncratic. Its language is i.e. about social values, and i.e. about awareness and beliefs—and neither of these lend themselves to rigorous measurement.
Data calls for consensus. While this is achievable in scientific research and business projects, when it comes to , it turns out that individuals and groups have markedly differing views about what should be measured, by whom and how. Furthermore, the social context is dynamic, so what is deemed important now will differ from what is deemed important 10 years ago or 10 years in the future. Above all, the continuous careful collection of relevant data is expensive, difficult to organise and its future usefulness not necessarily evident. As a result, while numbers are available, the foundations for "good data" must be taken to be absent.
See a fuller exposition in Sturge, G. (2022) "Bad Data: How Governments, Politicans and the Rest of Us Get Misled by Numbers" Littlebrown.
Example: ![]() Crime figures
Crime figures
Who Does the Work
Governments in many countries have independent statistical agencies that collect essential data about the operation of the country's institutions. The UN keeps a list of these![]() . Authoritarian regimes are likely to either falsify data or declare it a "state secret" in line with their opposition to .
. Authoritarian regimes are likely to either falsify data or declare it a "state secret" in line with their opposition to .
Collecting and comparing statistics amongst countries is handled by international bodies like UNESCO or OECD, some global charities like Amnesty International![]() , and some large commercial firms.
, and some large commercial firms.
However, it is up to individuals within each society to bring statistics to bear on processes for institutional improvement. Of course, the man-in-the-street or average researcher can do little whatever facts are to hand. It requires high status individuals, politicians or prominent professional or reform-oriented bodies to publicize numbers that they believe will focus attention and generate efforts for improvement.

Plotting the Work
Any will reflect the handling of some particular need or value and highlighting the most shocking figure requires a minimum of detailed knowledge about the institution itself. So this process is placed at the lower extreme of the Y-axis.
Valid are just numbers and there is no concern in relation to consensus. Until a particular statistic is identified, the public may not even be aware of it. When made aware the public will likely accept it without needing to understand or agree to its significance. So it is placed at the left-most extreme of the X-Axis.
We therefore locate in the lower left extreme of the lower left quadrant as shown in the diagram: again as expected for t5/L5.
Statistics do not speak for themselves. Their interpretation and implications can be diverse due to the differing perspectives and political ideologies of those with vested interests. The inevitable outcome is the propounding of controversial explanations and arguments, which need to be brought together and explored publicly.
- Continue to the 6th level/type of work: challenging perspectives.
Originally posted: 9-Oct-2022. Last updated 30-Jun-2023